
Figure 8.
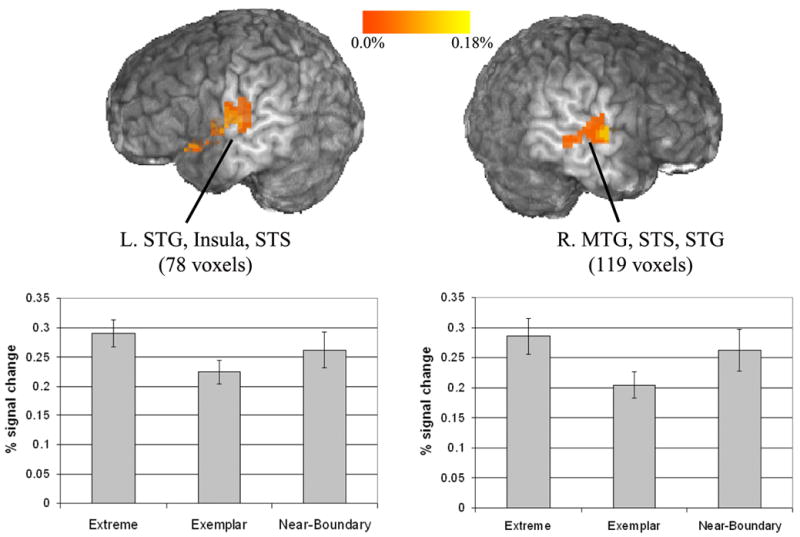
Left and right superior temporal clusters active in the Extreme vs. Exemplar contrast. Clusters active at a corrected threshold of p<0.05. Bar graphs show the extracted mean percent signal change across all voxels in the pictured cluster. Error bars indicate standard error.