
Figure 3.
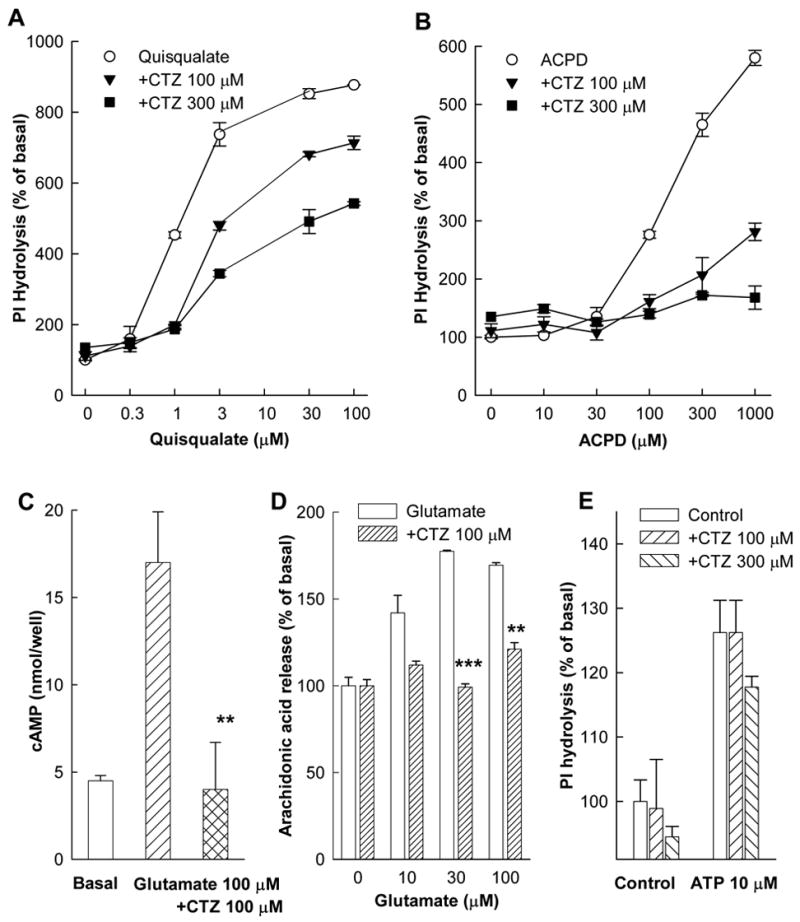
Effects of CTZ on different transduction pathways in CHO cell lines expressing mGluR1a. (A and B) Inhibition of PI hydrolysis in cells stimulated with different concentrations of quisqualate or ACPD. cAMP accumulation (C) and arachidonic acid release (D) were measured in cells stimulated by glutamate. CTZ was added together with the agonists. (E) Lack of CTZ effect on PI hydrolysis stimulated by ATP. Values represent means ± S.E.M. from at least 3 independent measurements. ** p<0.01 and *** p<0.001 by Student’s t-test as compared to respective data without CTZ.