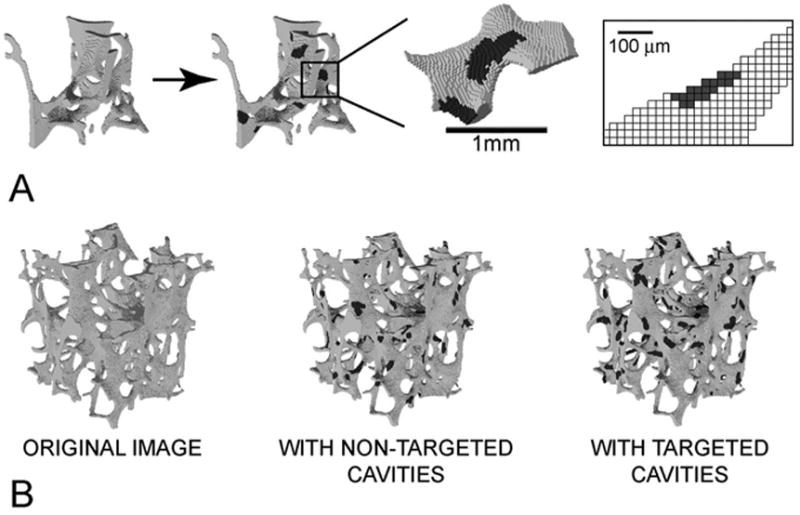
Figure 1.

(A) Cavities were added to the image of each specimen using custom software that prevented the cavities from disconnecting any trabeculae. Colored regions represent resorption cavities added to the bone surface. (B) Three finite element models were generated for each sample, one of the original image, one with resorption cavities placed at random (non-targeted), and one with resorption cavities placed on surface tissues experiencing the greatest tissue strain (targeted).
