
Figure 5.
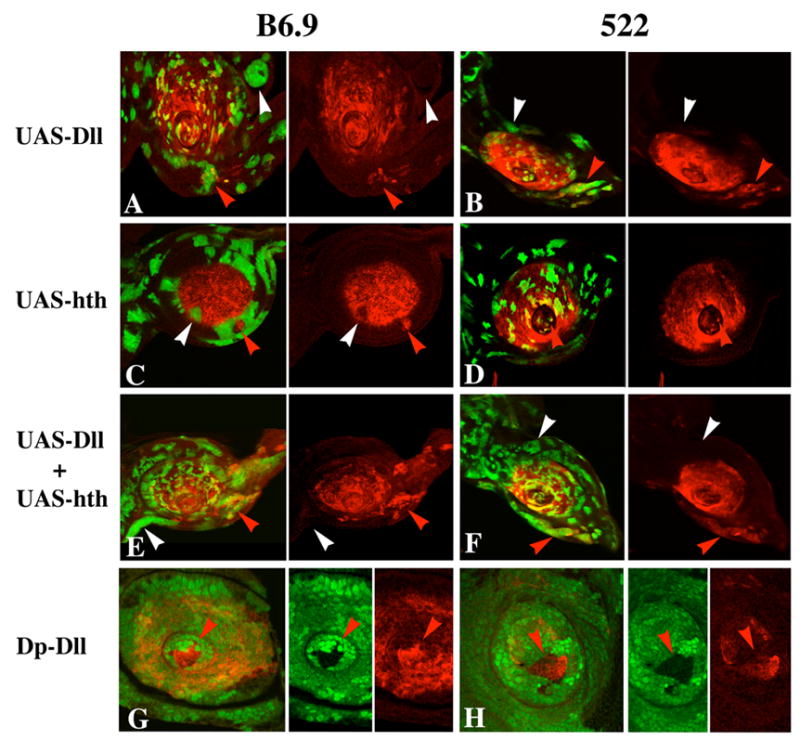
Effect of ectopic expression of Dll and Hth on expression of B6.9 and 522 in antennal discs. In all panels, clones are marked by GFP fluorescence (green) and β-galactosidase expression is in red. A, B: Dll-expressing clones induce expression of both B6.9 (A) and 522 (B) in the region ventral to the antenna (red arrowheads), but not elsewhere (white arrowheads). C, D: Hth-expressing clones often repress B6.9 and 522 proximally (white arrowheads), but upregulate 522 when located in the most distal (aristal) region (red arrowhead in D). Note that proximal Hth-expressing clones tend to follow the proximal limit of reporter expression (the A2–A3 boundary) for many cells (C). The disc shown in C is unusual in that a patch of β-galactosidase expressing cells is present proximal to the normal expression domain of the reporter (red arrowhead); whether this results from new induction of expression by the surrounding cells or from entrapment of originally distal cells is not clear. E, F: Clones expressing both Dll and Hth are very similar to clones expressing only Dll in their effects on B6.9 and 522 expression. G, H: Effects of varying Dll dosage on expression of 522 in antennal (G) and leg (H) discs. These discs contain clones carrying four doses of Dll+ (no green fluorescence) and two doses of Dll+ (bright green fluorescence), in a background of cells carrying three doses (light green fluorescence). Note the strong activation of 522 in the four-dose clones in both the antenna and leg (red arrowheads).