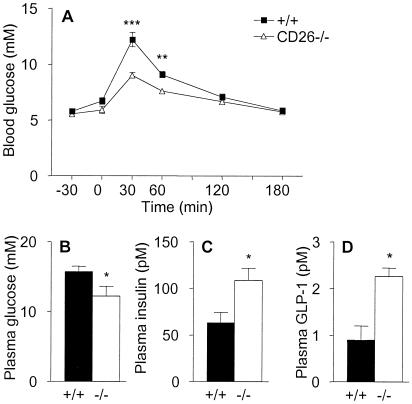
Figure 3.
Enhanced oral glucose tolerance and increased levels of insulin and GLP-1 in CD26−/− mice. (A) Blood glucose concentrations measured at various times before and after oral administration of glucose (given at time 0) to female wild-type or CD26−/− mice, as indicated. n = 7. Similar data were obtained in a repeat experiment and in two experiments on groups of male mice. (B–D) Levels of glucose (B), insulin (C), and intact GLP-1-(7–36) (D) in plasma from male wild-type (closed bars) and CD26−/− (open bars) mice taken 15 min after oral glucose challenge. n = 8. *, P < 0.05; **, P < 0.01; ***, P < 0.001. Similar data were obtained in two additional experiments.

