
Figure 1.
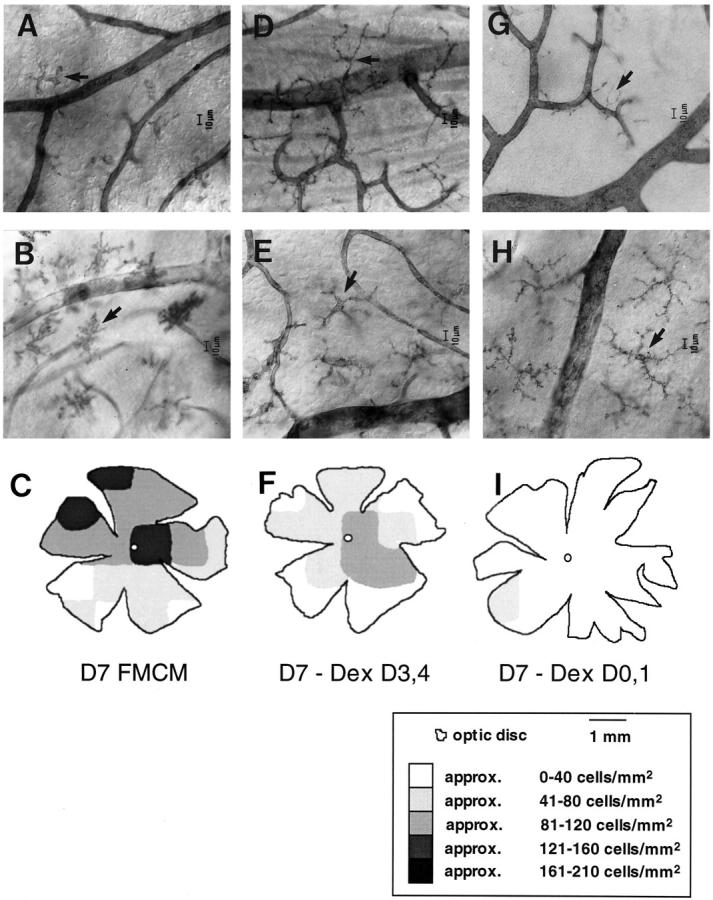
Micrographs show the amelioration of morphological changes of microglia in dexamethasone-treated FMCM mice at day 7 p.i. A−C: Microglia visualized with the GS lectin (A) and NDPase histochemistry (B), and the density of GS lectin-labeled microglia (C) at the terminal stage of FMCM. D−F: FMCM mice treated with dexamethasone on days 3 and 4 p.i. There was a marked reduction in the average density of microglia visualized using the GS lectin (compare C with F). This reduction in density was concomitant with a reduction in the extent of microglial morphological changes visualized with the GS lectin (D) and NDPase (E) histochemistry. Intensely stained GS lectin- and NDPase-labeled microglia with retracted processes and enlarged somas were still evident. However, these changes were mild compared with those in FMCM mice not treated with dexamethasone. G−I: FMCM mice treated with dexamethasone at days 0 and 1 p.i. The average density of GS lectin-labeled microglia (I) was similar to uninfected mice (21 versus 17 cells/mm2). 6 Similarly, microglia labeled with the GS lectin had a morphology typical of resting microglia (G). NDPase-labeled microglia also showed a typical morphology of resting microglia (H). However, the number of microglia visualized was greater than the number of GS lectin-labeled microglia (compare arrows in G and H), because NDPase labels the total microglial population. C, F, and I: Retinal maps showing the density of GS lectin-labeled microglia from FMCM mice treated with dexamethasone. The number of labeled microglia was determined within a 1-mm 2 region, and the cells/mm 2 were converted to a gray scale. Each map is of a single retina representative of the changes observed. Each micrograph is representative of 6 mice.