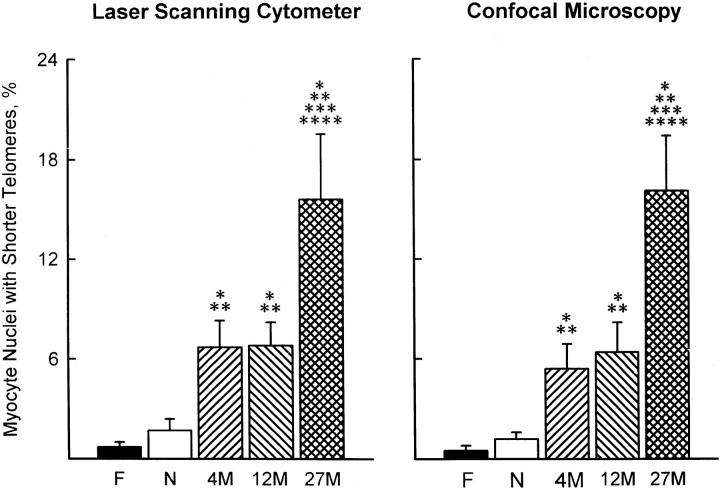
Figure 3.
Measurements of the percentage of myocyte nuclei with shorter telomeres by laser scanning cytometer and confocal microscopy (see Figure 2 ▶ for symbols). Asterisks indicate statistical differences (P < 0.05) from F (*), N (**), 4M (***), and 12M (****) values; n = 5 in each group.

