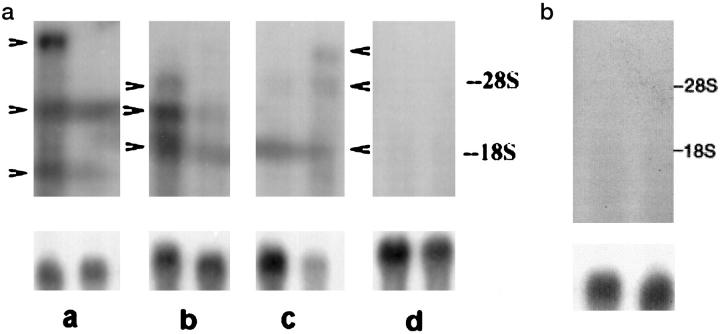
Figure 2.
a: Northern blot analysis of the total RNA from the feather tissue of SL101 and BL101 chickens treated with 5-Azacytidine. Upper panel: EV genes. Lower panel: β-actin gene. Lane a, SL untreated; lane b, SL 5-AzaC-treated; lane c, parental control (BL)-5-AzaC-treated; lane d, BL untreated. Arrowheads indicate the position of EV transcripts. Calf liver rRNA (28S and 18S) was used as the RNA size standard. b: Northern blot analysis of the total RNA from the spleen tissue of SL101 birds treated with 5-AzaC and showing vitiligo. Upper panel: EV genes. Lower panel: β-actin gene.

