
Figure 6.
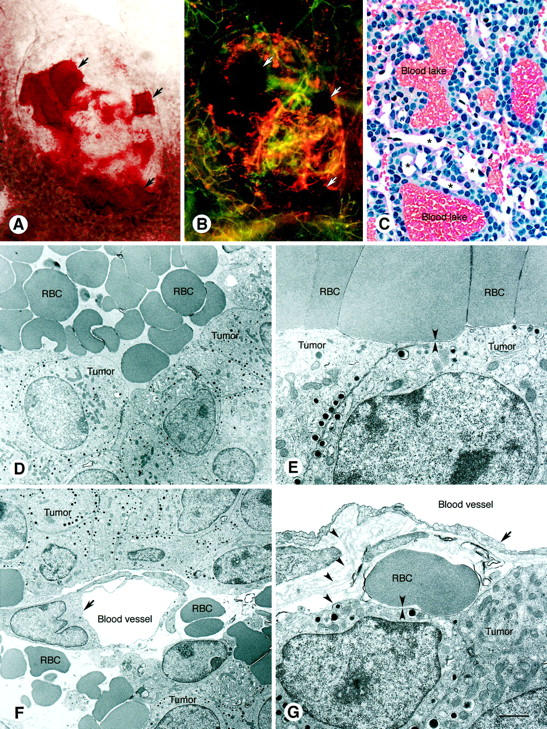
Blood lakes in pancreatic islet cell tumors in transgenic RIP-Tag2 mice. Brightfield (A) and fluorescence (B) micrographs showing blood lakes (arrows) in a whole mount of a small (∼1 mm) RIP-Tag2 tumor. In A, red blood lakes stand out from the remainder of the tumor washed free of blood by vascular perfusion of fixative. In B, blood lakes appear black, whereas blood vessels are marked by green fluorescent lectin and orange-red fluorescent cationic liposomes injected intravenously before fixation. Cationic liposome fluorescence predominates in the tumor; lectin fluorescence predominates in the surrounding normal acinar pancreas. C: Histological section of RIP-Tag tumor showing blood lakes. Also shown are tumor vessels (*), which are much smaller than the lakes and were emptied of blood by perfusion of fixative. Hematoxylin-and-eosin-stained 2-μm methacrylate section. D and E: Transmission EM of blood lakes showing erythrocytes (RBC) next to tumor cells. D illustrates the proximity of RBC and tumors (arrowheads). F and G: Transmission EM showing endothelial cells (arrows) of tumor blood vessels, emptied of blood by perfusion fixation, surrounded by extravasated erythrocytes (RBC). In G, the blood vessel and cluster of tumor cells are enveloped by multiple layers of basement membrane (arrowheads). At this site, an erythrocyte and tumor cells are separated by basement membrane (apposing arrowheads). Scale bar in G applies to all figures; bar length represents 150 μm in A and B; 30 μm in C; 3 μm in D and F; 1 μm in E and G.