
Figure 2.
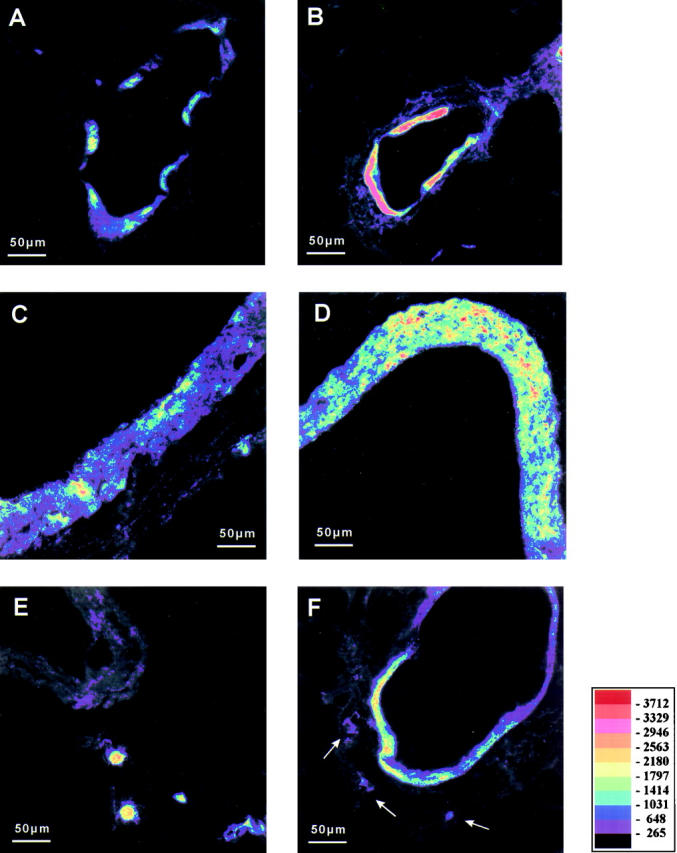
Immunostaining of Cox-2, epipolarization. A, C, and E show different structures of control lungs. B, D, and F show comparable structures from LPS-treated groups; differences of staining intensity are visualized by pseudocolor conversion of the epipolarization image. Vascular smooth muscle cells of partially muscular vessels express Cox-2 in buffer-perfused control lungs (A). Up-regulation of Cox-2 in the smooth muscle layer of partially muscular vessels in LPS-treated lungs is visible by the shift of pseudocolors representing the staining intensity (B, 1,000 ng/ml, 2 hours perfusion time). Figure 1, C and D ▶ , shows myocytes of large hilar veins under control conditions (C, 1 hour buffer perfusion) and after LPS-exposure (D, 10,000 ng/ml, 1 hour perfusion time). Perivascular macrophage-like cells exhibit strongest Cox-2 staining intensity in control lungs (E, control with 2 hours buffer/plasma perfusion), but are hardly detectable in lung tissue after LPS-treatment (F, arrows, 10,000 ng/ml LPS, 2 hours buffer/plasma perfusion). Scale bar, 50 μm.