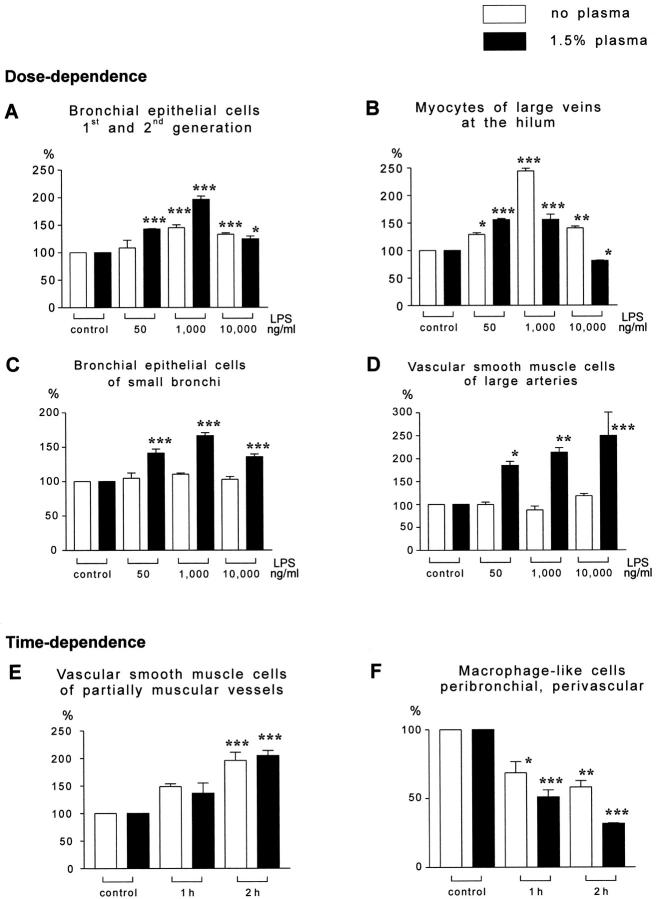
Figure 3.
Quantitative evaluation of Cox-2 staining intensity relative changes in response to LPS exposure. Mean ± SE for buffer-perfused (open bars) or buffer/plasma-perfused (closed bars) lungs are given (each group n = 5 lungs); all data refer to the respective controls, which were set at 100%. Each group comprised 5 independent lung experiments with cross-sections from three randomly selected tissue blocks originating from different lobes of each lung. Dose and time dependencies are indicated. Note the different response patterns: i) Cox-2 up-regulation in the absence and presence of plasma, eg, bronchial epithelial cells of large bronchi (A), myocytes of large hilum veins (B), and VSMC of partially muscular vessels (E). ii) Cox-2 up-regulation only in the presence of plasma, eg, bronchial epithelial cells of small bronchi (C), vascular smooth muscle cells of large arteries (D). iii) Cox-2 down-regulation in macrophage-like cells in the peribronchial and perivascular tissue (F). P < 0.05 (*), P < 0.01 (**), P < 0.001 (***), compared to the respective control groups.

