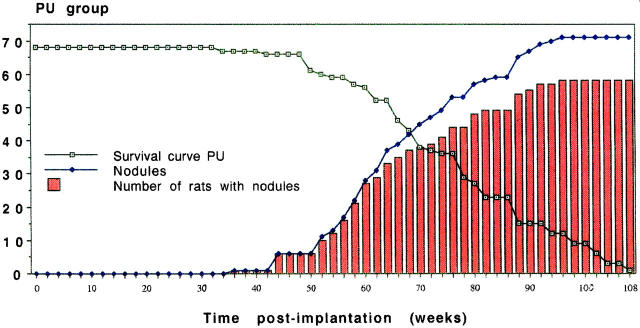
Figure 2.
Development of sarcoma in a total of 68 rats (male and female taken together) in the PU group during the 2-year study. The Kaplan-Meier type of survival curve is shown by the open squares. It should be stressed that these curves are based on the endpoint 50 g tumor weight and not on actual survival of tumor-bearing animals. These curves are thus Kaplan-Meier-like. Tumors did not appear until week 36, after which time a steady increase in macroscopically manifest tumors arose (♦). The number of rats bearing tumors is shown by the histograms. The latter values are below those for the number of tumors, as some rats carried more than one tumor.

