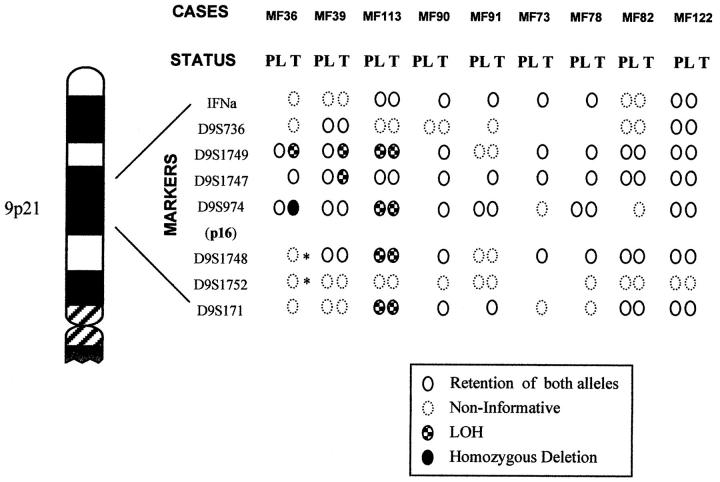
Figure 2.
Summary of allelic loss data for the 9p21 region in MF. Graphic representation of the eight microsatellite markers. All cases studied are illustrated in plaque (PL) and tumoral (T) stages. Noninformative cases marked with an asterisk indicate a signal markedly diminished in comparison with normal DNA.

