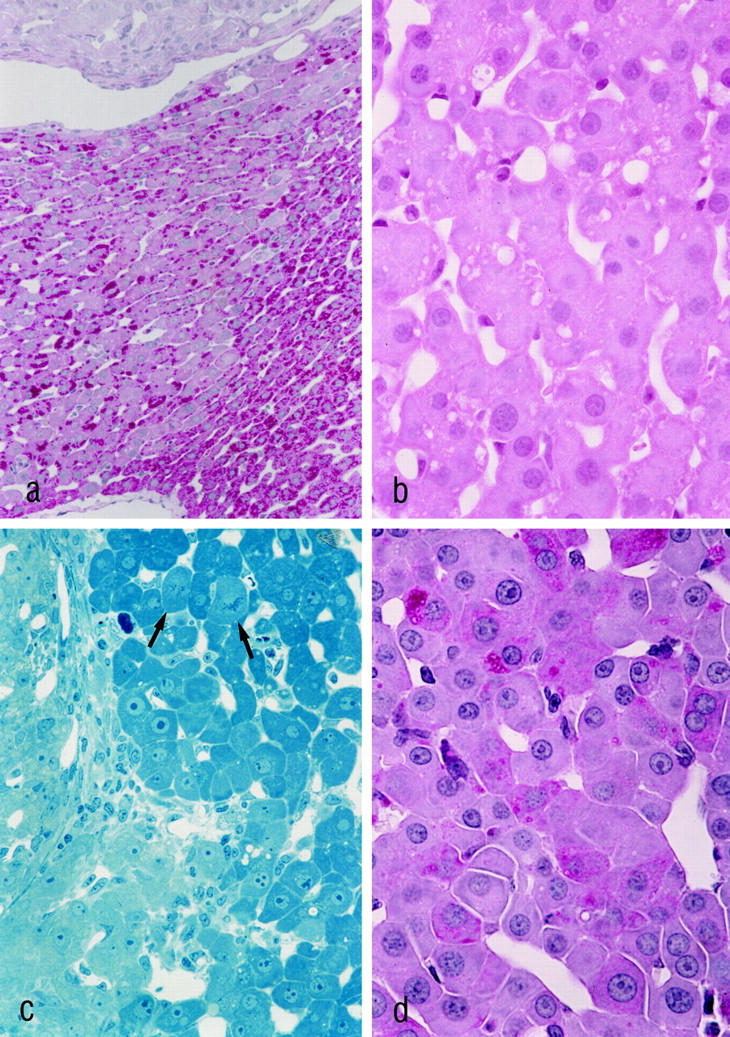
Figure 3.

Histological features of the altered liver acini in MG 3 weeks (a–c) and 3 months (d) after transplantation. In a, the PAS-stained section demonstrates the decrease in glycogen in the liver acinus downstream of the ovarian transplant. The transplant, which is situated in a portal vein branch, is shown at the upper margin, and the draining hepatic venule is visible at the lower margin of the figure ▶ . The H&E stain (b) reveals a distinct cytoplasmic amphophilia of the altered hepatocytes. In c, the pale cells on the left are corpus luteum cells. The hepatocytes of the altered liver acinus in the right part of the figure ▶ exhibit enlarged nuclei with prominent nucleoli. Mitotic figures are indicated by arrows. Three months after transplantation, the typical cell plate pattern of hepatocytes is partly replaced by thickened trabeculae consisting of more than two cell layers of hepatocytes (d). a and d: PAS reaction; b: H&E-stained paraffin section; c: Epon section stained according to the method of Richardson. 40 Original magnifications: a, ×225; b and d, ×725; c, ×470.
