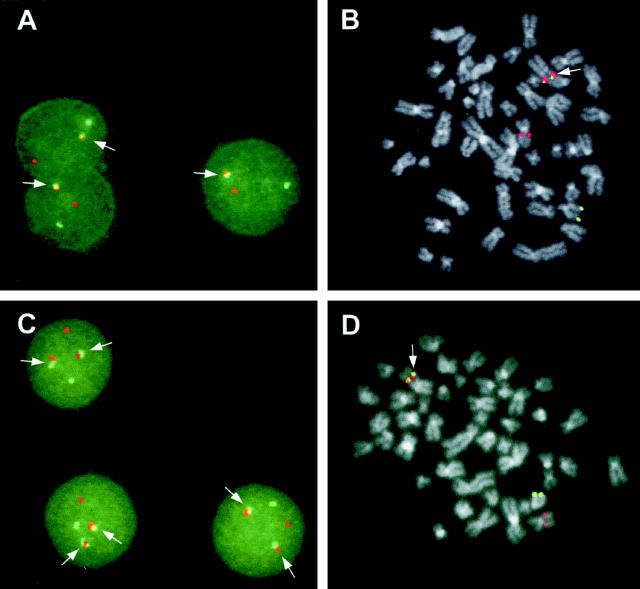
Figure 3.
FISH analysis of the t(11;14) translocation in MM with 11q13 breakpoints. A and B: Interphase and metaphase FISH in case no. 39. C: Interphase FISH in case no. 34. D: Metaphase FISH in case no. 47. Red signal (FGF3); green signal (IGH-constant μ, γ1–4, α1–2 regions). The arrows indicate the FGF3-IGH association on the putative 14 (der).

