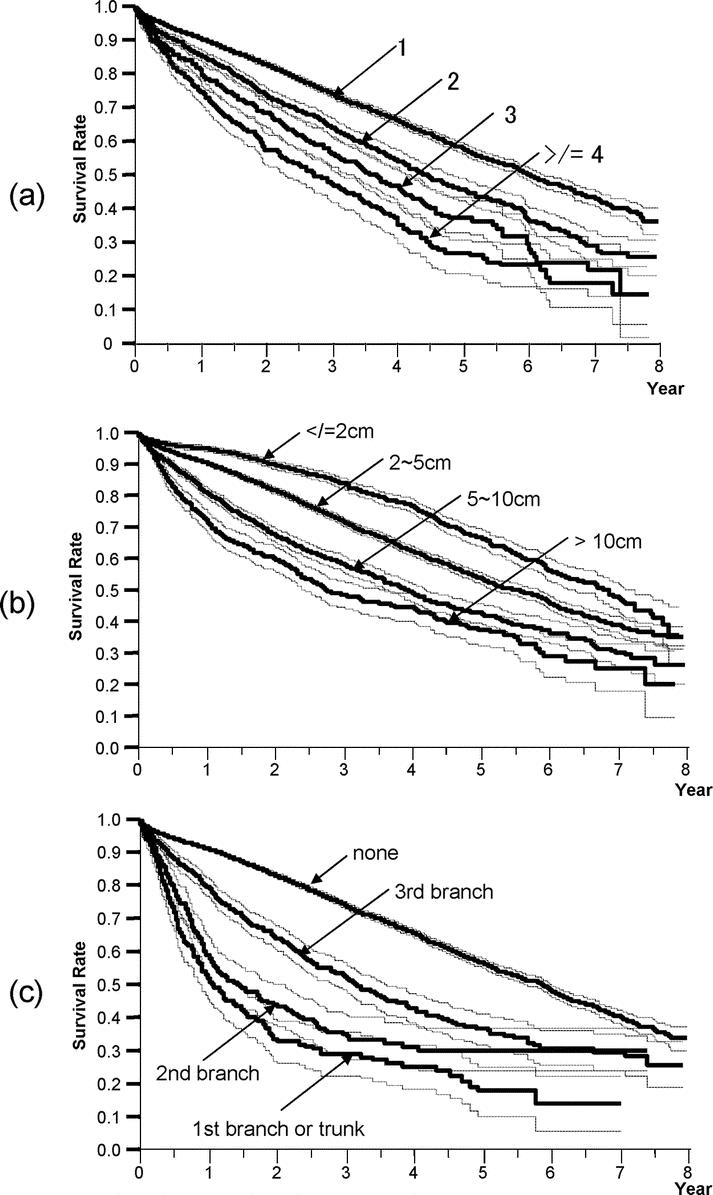
FIGURE 3. Kaplan-Meier survival analysis (solid line) with 95% confidence interval (dotted line) for patients in the curative-hepatectomy-N0M0 cohort stratified according to the number of liver nodules (a), the maximum diameter of liver nodules (b), and the location of portal invasion (c). The number, median survival time (95% CI), and 5-year survival rate of patients are described in Table 4.
