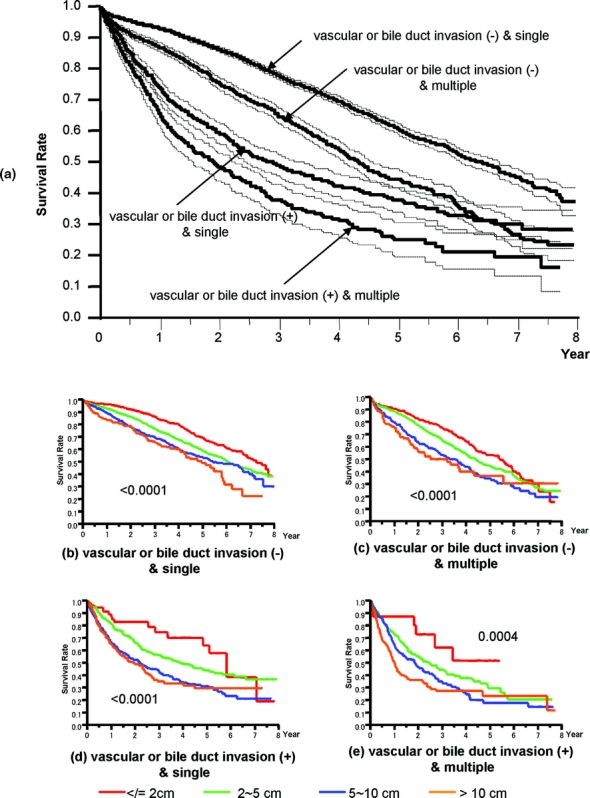
FIGURE 4. Kaplan-Meier survival analysis (solid line) with 95% confidence interval (dotted line) for patients in the curative-hepatectomy-N0M0 cohort stratified according to vascular or bile duct invasion, and growth pattern (single or multiple). The number, median survival time (95% CI), and 5-year survival rate of patients with vascular or bile duct invasion (−) and single, vascular or bile duct invasion (−) and multiple, vascular or bile duct invasion (+) and single, and vascular or bile duct invasion (+) and multiple were 8565, 6.41 years (6.08–6.71), 61%; 2461, 4.37 years (4.12–4.61), 45%; 1163, 2.90 years (2.48–3.23), 38%; and 615, 1.92 years (1.56–2.28), 25% (P < 0.0001) (a). Influence of tumor size in the 4 groups (b, c, d, e). Tumor size significantly influenced survival in all of the groups.
