
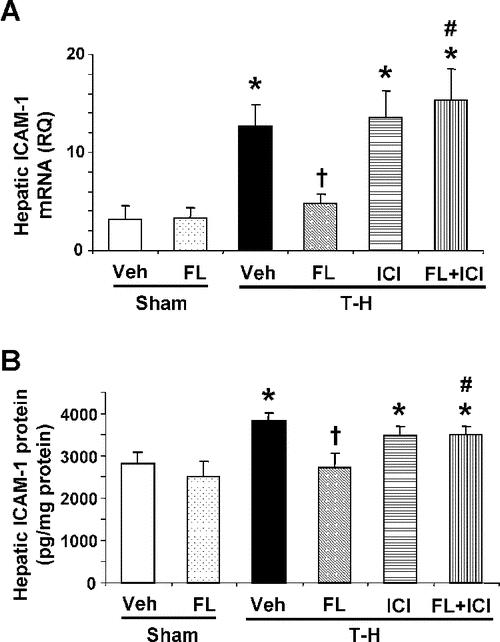
FIGURE 3. Effect of flutamide treatment on hepatic mRNA (A) and protein expression (B) of ICAM-1 at 2 hours after sham operation or trauma-hemorrhage. Data are presented as mean ± SEM (n = 3–5 animals/group for mRNA expression and n = 6 animals/group for protein expression). *P < 0.05 versus sham. †P < 0.05 versus T-H. #P < 0.05 versus corresponding group without ICI 182,780. T-H, trauma-hemorrhage; Veh, vehicle treatment; FL, flutamide treatment; ICI, ICI 182,780 treatment; RQ, relative quantity.