
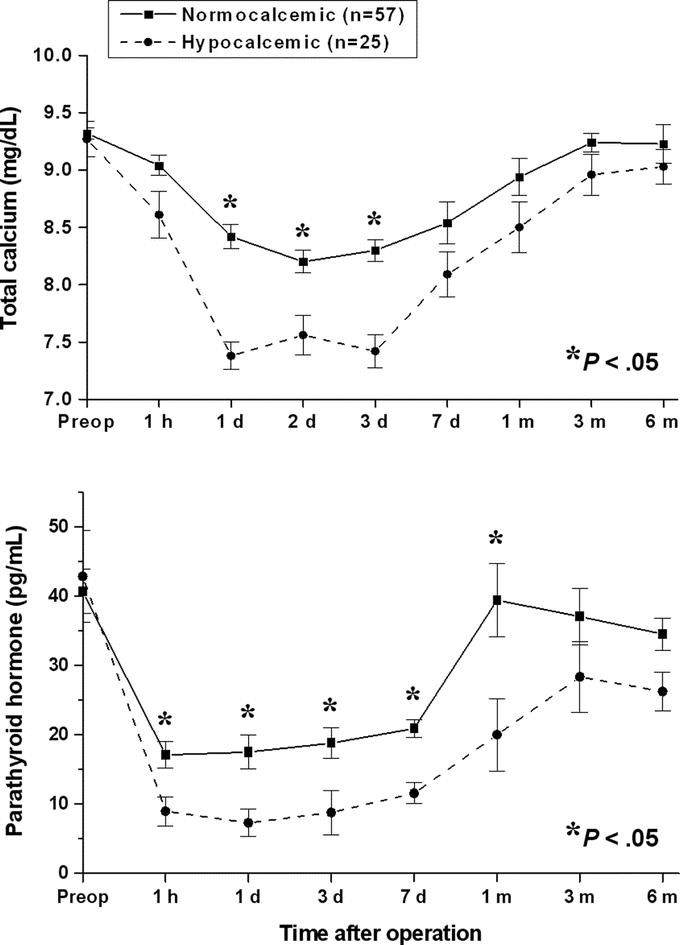
FIGURE 2. Changes in total calcium (upper panel) and intact parathyroid hormone (lower panel) levels before and after total thyroidectomy plus neck dissection in the with or without postoperative hypocalcemia groups. Values represent mean ± SEM. *t test.