
Figure 9.
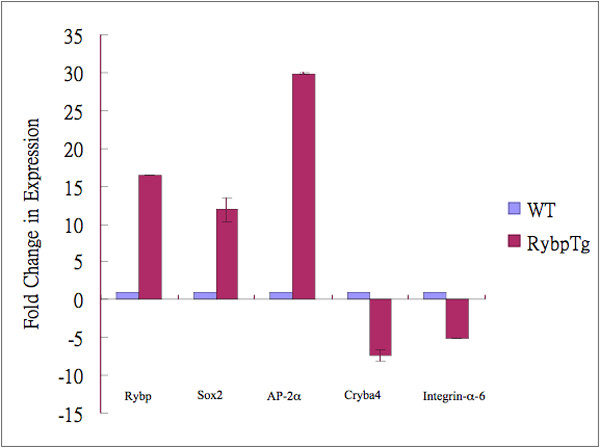
Quantitative RT-PCR analysis of transgenic lenses overexpressing Rybp. Relative change in expression level of Rybp, Sox2, AP-2α, βA4-crystallin and α6-Integrin transcripts in the P1 lens. All data are normalized to B2M expression level. Error bars indicate standard deviation.