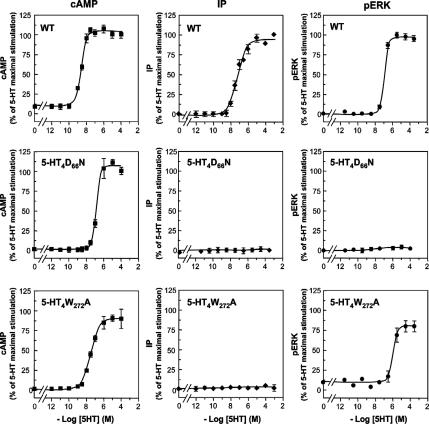
Figure 3.
5-HT-stimulated second messengers (cAMP and IP) and phosphorylation of ERK1/2 in HEK293 cells. Comparison between the effects of 5-HT4R WT and defective mutants. HEK293 cells transiently expressing either 5-HT4R WT or mutants (D66N or W272A) were treated with increasing concentrations of 5-HT for cAMP production (5 min), IP production (30 min), and p-ERK1/2 (5 min). Receptor expression levels were similar for all the receptors as revealed by enzyme-linked immunosorbent assay that allowed quantifying relative cell surface receptor expression before agonist stimulation (data not shown). Basal and 5-HT–stimulated cAMP values were 1 ± 0.5 and 9 ± 2 pmol/well, respectively. Basal and 5-HT-stimulated IP values were 0.15 ± 0.5 and 10 ± 3 pmol/well, respectively. For WT, data are expressed as a percentage of the maximum second messenger (cAMP or IP) or p-ERK produced after stimulation with 5-HT 10 μM for 5 min (cAMP and p-ERK) or for 30 min (IP) (top). For mutants, data are expressed as a percentage of the maximum cAMP, IP, or p-ERK1/2 produced by the WT stimulated with 10 μM 5-HT, as indicated above. Analysis of p-ERK1/2 and total ERK content was performed by immunoblotting and quantified by densitometry. The amounts of p-ERK1/2 were always normalized to the total ERK signal obtained by stripping the same immunoblot and determined with the antibody to ERK42/44. Curve fitting was performed with the GraphPad Prism software. For all the curves, the data are the mean ± SEM of at least four independent experiments.

