Figure 4.
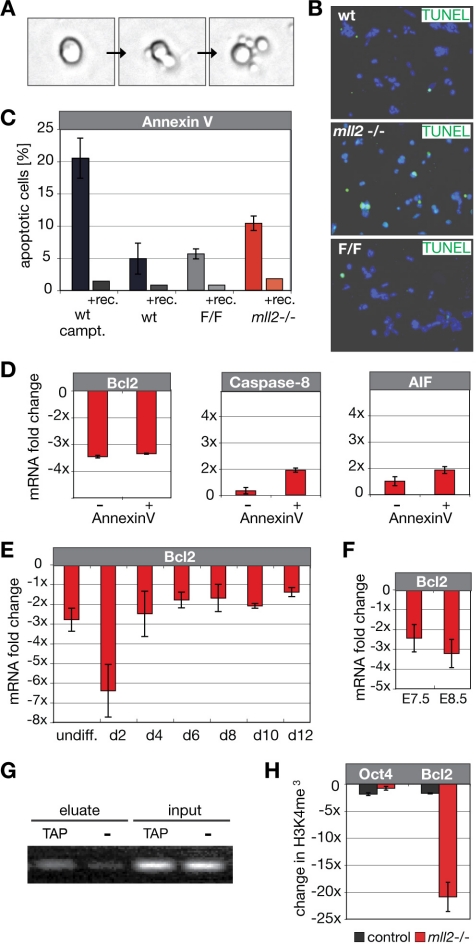
Enhanced rates of apoptosis in mll2 mutant ES cells. (A) Tracking of mitotic cell divisions in time-lapse movies of asynchronous ES cell cultures. Detail screens from a time-lapse movie of mll2−/− ES cells indicate the occurrence of apoptotic cell death upon cell division. (B) Immunohistochemical detection of apoptosis in ES cell colonies based on enzymatic labeling of DNA strand breaks (TUNEL). Nuclei were counterstained with DAPI. (C) Apoptosis rates in wild-type, FLP-rescued, and mll2−/− ES cells determined by Annexin V flow cytometry. Left bars represent values for ES cell clones incubated with Annexin V-APC and PI; right bars indicate values for ES cells blocked with recombinant Annexin V protein (indicated as +rec.). Experiments were performed three times with similar results; data are means ± SD. Significance was determined by analysis of variance with a student's t test, p < 0.025. (D) Expression levels of apoptotic marker genes in mll2 mutant cells. Apoptotic ES cells were separated from viable cell fractions by FACS sorting by using fluorescently labeled Annexin V-APC. Total RNA from both populations was isolated and quantitative PCR (qPCR) was performed to examine expression levels of pro- and antiapoptotic markers (Bcl2, anti-apoptotic; Caspase-8 and AIF, proapoptotic). Graphs illustrate expression changes of respective genes in FACS-sorted viable [Annexin V (−)] and apoptotic [Annexin V (+)] mll2−/− ES cell populations compared with the average expression profile observed with wild-type and FLP-rescued ES cell fractions. (E) Bcl2 expression profile in mll2 mutant cells upon in vitro differentiation. ES cells were differentiated via mass culture of embryoid bodies and analyzed by qPCR at days indicated. Bars represent fold decrease of Bcl2 expression in mll2−/− cells compared with wild-type and FLP-rescued cells. Analysis was performed in triplicates. (F) Decrease in Bcl2 expression levels in early mll2 mutant embryos compared with wild-type and heterozygous mll2 +/− embryos. Embryos were dissected at embryonic day 7.5 or 8.5. For each time point, total RNA of three mll2 +/+, +/−, and −/− embryos was reverse transcribed and used for qPCR analysis. Data are means of triplicate analysis ± SD. (G) Chromatin immunoprecipitation analysis for Bcl2 on Mll2-TAP tagged ES cells. Cell lysates of Mll2-TAP ES cells were immunoprecipitated with IgG beads via the protein A of the TAP-tag. Untagged wild-type ES cells were used to determine background levels. DNA of input and immunoprecipitated eluates was PCR amplified with Bcl2-specific primers and separated by gel electrophoresis. (H) Chromatin immunoprecipitation of mll2−/− ES cells with H3K4me3-specific antibodies. Heterozygous mll2+/− ES cells were used as a control. Expression levels of Oct4 and Bcl2 were determined by qPCR. Ct values were normalized against input DNA. Bars represent fold changes in H3K4me3 between mll2−/− and wt ES cells. Error bar represent SD of triplicate analysis.

