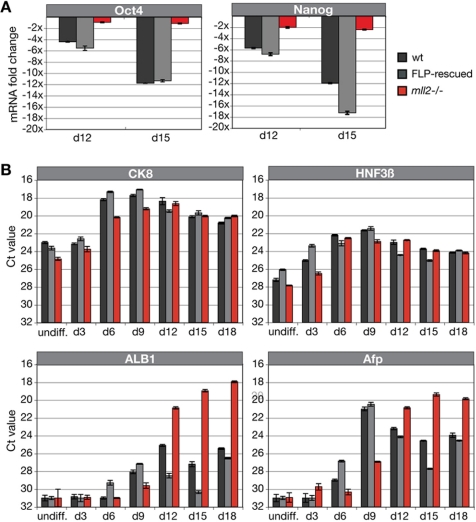
Figure 7.
Endodermal differentiation of ES cell clones in vitro. (A) Quantitative PCR analysis of Oct4 and Nanog gene expression upon in vitro differentiation into endoderm. Graphs illustrate expression changes of respective genes on day 12 or 15 relative to the undifferentiated state. Fold changes were calculated from RPL19-normalized Ct values; error bars represent SD of triplicate analysis. (B) Quantitative analysis of endoderm-specific transcripts in wild-type, F/F, and mll2−/− ES cells at different time points during endodermal in vitro differentiation. Expression levels of early endodermal markers, cytokeratin 8 (CK8) and hepatocyte nuclear factor 3 β (HNF3β), and late endodermal markers, albumin 1 (ALB1) and α-fetoprotein (Afp), were normalized against the internal standard gene RPL19. Data are means of triplicate analysis ± SD.

