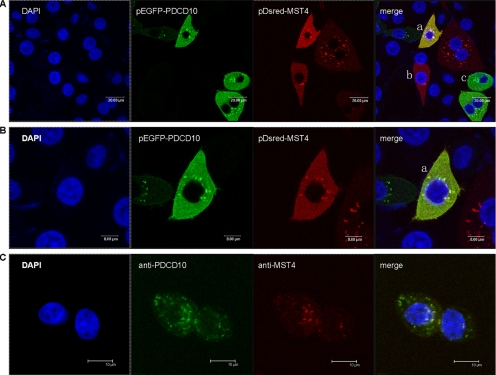
Figure 2.
Colocalization of PDCD10 and MST4 in HeLa cells. (A) Confocal microscopy images of cells cotransfected with pEGFP-C3-PDCD10 (green) and pDsred-N1-MST4 (red) plasmids, with coexpression in yellow. Cell nucleus morphology was observed by DAPI staining (blue). a, b, and c represented three different cells. Cell b was transfected with pDsred-N1-MST4 plasmid and cell c with pEGFP-C3-PDCD10; however, cell a was cotransfected with both plasmids. It showed that either pEGFP-C3-PDCD10 or pDsred-N1-MST4 localized to the cytoplasm with some concentrated spots around the nucleus, and the distribution did not changed when cotransfected PDCD10 and MST4. (B) The same layer with 2× magnification of A, which showed that the distribution of MST4 entirely overlapped with PDCD10. (C) The HeLa cells costained by anti-PDCD10 antibody and FITC-conjugated goat anti-mouse IgG, anti-MST4 antibody, and TRITC-conjugated bovine anti-rabbit IgG in turn, for the endogenous immunofluorescence microscopy of PDCD10 and MST4. It exhibited that either PDCD10 or MST4 localized around the nucleus as highly concentrated spots, and the distribution of MST4 overlapped with PDCD10. Experiments were performed in triplicate, with similar results.

