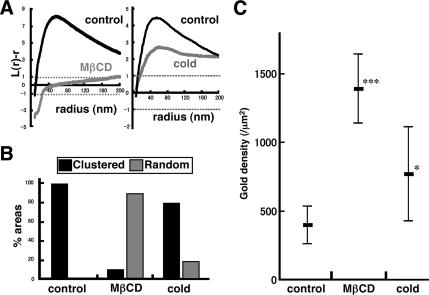
Figure 6.
Changes observed after cholesterol depletion and chilling in normal mouse fibroblasts were also observed in GM1-null fibroblasts loaded with exogenous GM1. (A) The mean L(r) − r curve shows a decrease of clustering after cholesterol depletion by MβCD or after chilling. The change was more drastic by cholesterol depletion than by chilling. (B and C) The proportion of areas showing random distribution as well as the average labeling density also increased significantly by cholesterol depletion or chilling.

