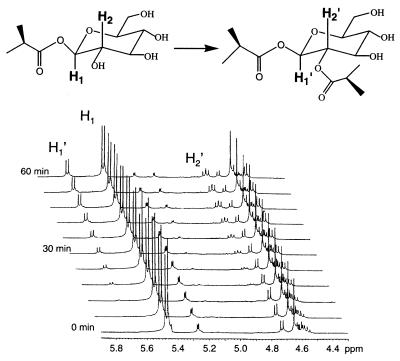
Figure 5.
1H-NMR of the disproportionation reaction catalyzed by L. pennellii glucose acyltransferase. The zero-time spectrum was acquired immediately after addition of acyltransferase to the NMR tube. Acylation at H-2 is indicated by the time-dependent appearance of a downfield-shifted anomeric proton (H1′), and appearance of the downfield-shifted H-2′ (in the nonacylated substrate, the signal for H-2 is present in the complex cluster of signals around δ4.6).

