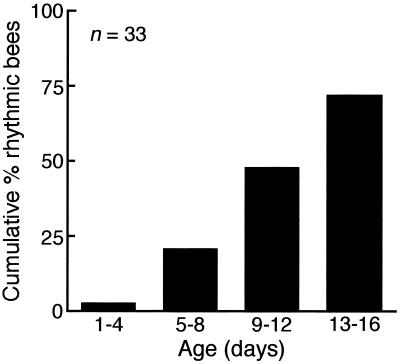
Figure 2.
Age-related changes in percentage of bees showing circadian rhythms for locomotor behavior. For each bee, periodogram analysis was performed on data from successive 4-day intervals to determine when there was significant circadian rhythmicity (P < 0.01). Cumulative proportions of rhythmic bees are depicted on graph; G tests were performed on actual frequencies to determine whether the distribution of rhythmic bees changed with age (results in text). Data are from the second trial of this experiment, in which 25% of the bees never showed circadian rhythms during the observation period. Results of the other two trials are not shown (descriptive statistics in text).

