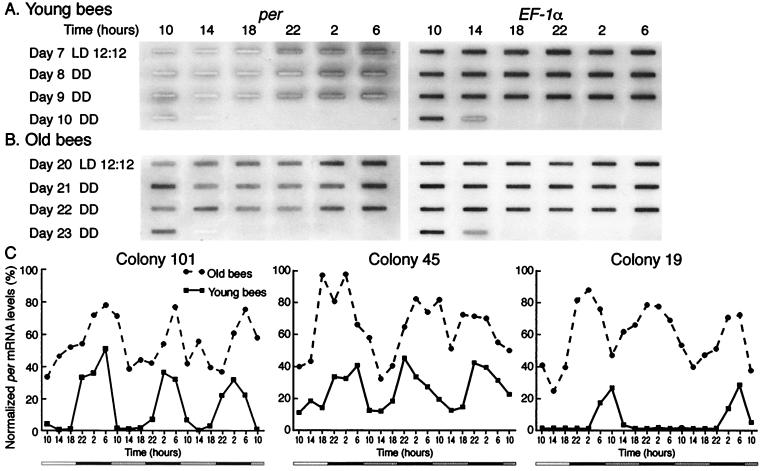
Figure 3.
Differences in per mRNA levels in the brains of young and old bees. Representative RNA slot blots (A and B) from one of the three laboratory colonies studied and densitometric analyses (C) from all three colonies (National Institutes of Health image version 1.6.1 software) for 7- to 9- and 20- to 22-day-old bees. Blots were quantified by scanning only a rectangular region within each slot (darkened background areas around some slots are artifacts and were not used for quantification). Images were scanned to produce the figure by using adobe photoshop. Results normalized to EF-1α mRNA values for each point. Bar below x axis: day (open bar) and night (filled bar) for LD and subjective day (hatched bar) and night (filled bar) for DD. Levels of EF-1α mRNA in the brain (data not shown) did not vary with age (ANOVA; P > 0.40, F = 0.774, n = 14). Slots in the Day 10/Day 23 14-hour positions contain bovine rRNA as a negative control (same quantities as the bee RNA).

