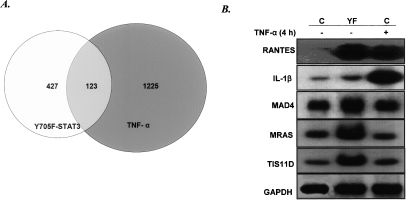
Figure 5.
Comparison of genes induced by high-level expression of Y705F-STAT3 with those induced by treatment with TNF-α. hTERT-HME1 control cells or YF cells were treated with 50 ng/mL TNF-α for 4 h or were untreated. Total RNAs were isolated and analyzed by using the CodeLink gene chip system. Genes with a more than threefold change in expression, compared with expression in untreated hTERT-HME1 cells, were scored. (A) Comparison of the genes expressed in response to a high level of Y705F-STAT3 or treatment with TNF-α. (B) Northern analysis of gene expression.

