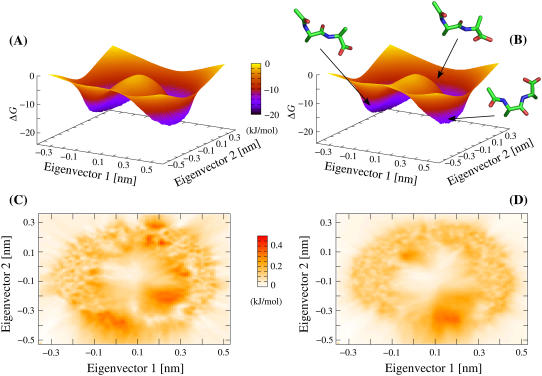
FIGURE 1.
Comparison of dialanine ensembles generated by TEE-REX and MD. Gibbs relative free energy surfaces (in units of kJ/mol) with respect to the first two MD-derived (see Methods section) backbone eigenvectors ({es}) are shown for a TEE-REX ensemble (A) and an ensemble from a 420-ns MD trajectory (B) overlaid by representative structures found along the system pathway. Transitions between the “open” (left basin) and the “closed” (right basin) conformation along the lower pathway are hindered by a free energy barrier (saddle) of ∼15 kJ/mol. The saddle region is sampled more intensely by TEE-REX. All calculations were carried out on an equal number of samples. (C and D): standard deviations (top view, units of kJ/mol) σTEE-REX (C) and σMD (D), calculated for all four TEE-REX and all nine MD free energy surfaces, respectively. Statistical errors of ≤0.4 kJ/mol ≃ 0.15 kBT are comparable for both methods.

