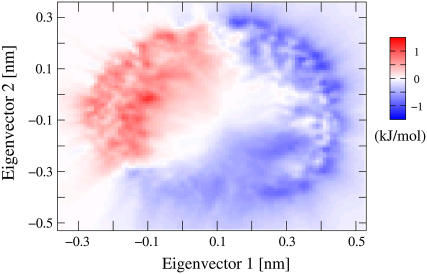
FIGURE 2.
Top view of the difference in free energy 〈ΔGTEE-REX − ΔGMD〉, averaged over all combinations  (i = 1, …, 4; j = 1, …, 9). Areas colored in blue are more frequently sampled by TEE-REX than by MD. Maximum differences of ±1.5 kJ/mol ≃ ±0.6 kBT are comparable to the statistical error of 0.15 kBT for each method. High-energy regions (e.g., saddle region in the lower middle) are better sampled by TEE-REX. Low-energy configurations of the “open” state are preferred by MD.

