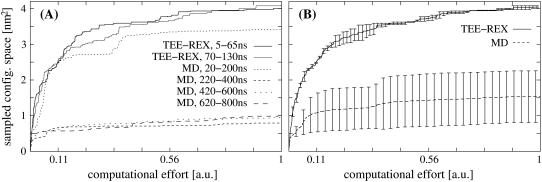
FIGURE 4.
Quantitative comparison of TEE-REX sampling performance with respect to MD for a guanylin test system. Sampled configuration space volumes Vi(τ) (in units of nm2) are measured versus computational effort τ (in units of 180-ns MD simulation time) for trajectory projections onto the first two eigenvectors of the six-dimensional essential subspace excited in the TEE-REX simulation of guanylin. (A) TEE-REX performance curves (dark and light solid lines) versus MD performance curves (dashed lines); (B) Average TEE-REX (solid) and MD (dashed) sampling performance 〈Vi(τ)〉 ± σi with error bars denoting standard deviations σi. On average, TEE-REX significantly outperforms MD. The large MD error bars show the dependence of the sampling on the starting structure.

