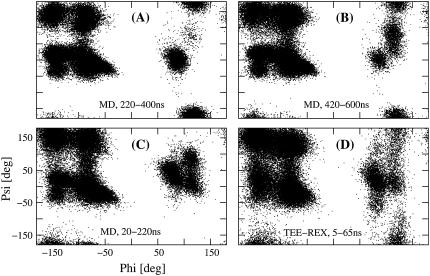
FIGURE 5.
Ramachandran plots of different guanylin MD and TEE-REX ensembles (for clarity, axes' labels are only shown for panel C). MD ensembles 20–220 ns (C), 220–400 ns (A), and 420–600 ns (B) are compared with a TEE-REX ensemble, running 5–65 ns (D). Enhanced sampling of TEE-REX with respect to MD is observed.

