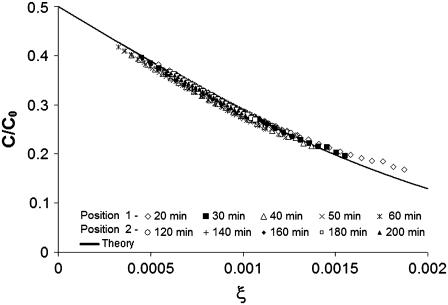
FIGURE 4.
Scaling plot of IGF-I-Cy5, all data shown in Fig. 3 for both fields of view and all time delays. Points are replotted versus ξ = x/t1/2. The global single-parameter best fit of Eq. 4 is the solid line. For each image, 27 equispaced data points were plotted. The actual data set contains 512 data points from each of 10 images.

