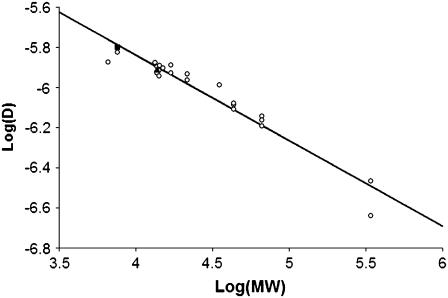
FIGURE 5.
Diffusion coefficient of proteins (cm2/s) versus MW. The values determined in our experiments are shown as filled symbols (triangle = RNase, square = IGF-I), and values from the literature are shown as open symbols. All values corrected to 25°C. See Table 2 for the individual values of D. The slope of the best-fit straight line is −0.4264.

