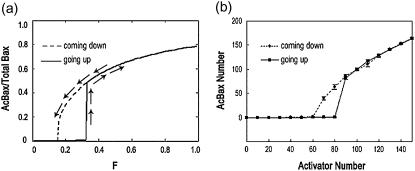
FIGURE 8.
Going-up and coming-down analysis with stimuli F as parameter of the core module of Bax activation. (a) In the ODEs modeling of the core module of Bax activation, the amount of Activator, which represents the stimuli F (F1 = F3 = 0, F2 varies from 0 to 1), is varied along two directions (going-up and coming-down) and the AcBax numbers of final steady states are plotted versus F. (b) In the CA modeling of the core module of Bax activation, the amount of Activator, which represents the stimuli F, is varied along two directions (going-up and coming-down) and the AcBax numbers of final steady states are plotted versus the number of Activator (mean ± SE of three independent simulation results). The reaction rate constants are given as K1(300), K2(12), K3(800), K4(3), K5(1000), K6(1), K7(500), and K8(300). All other rate constants are set to be zero.

