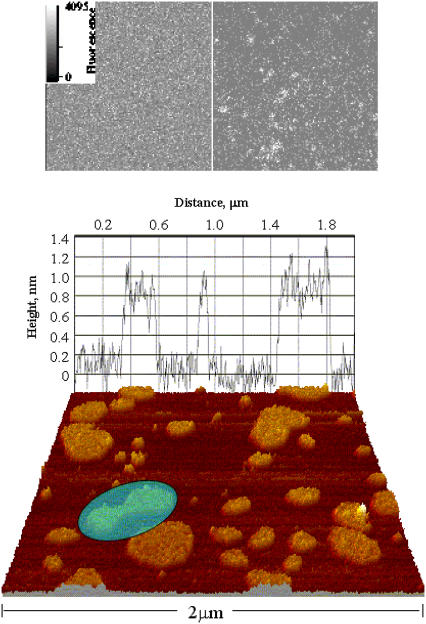
FIGURE 2.
(Upper) Fluorescent images of FPE-labeled PC100% (left), and PC67%/cholesterol33% (right). The images were obtained at room temperature with the bilayers submerged in Tris buffer (10 mM Tris, pH 7.4). (Lower) AFM image of the bilayer, illustrating cholesterol-enriched microdomains. The grape corresponds to the membrane topography at that location. Note the topology change (highlighted), where two microdomains are sintering together (or possibly splitting apart).

