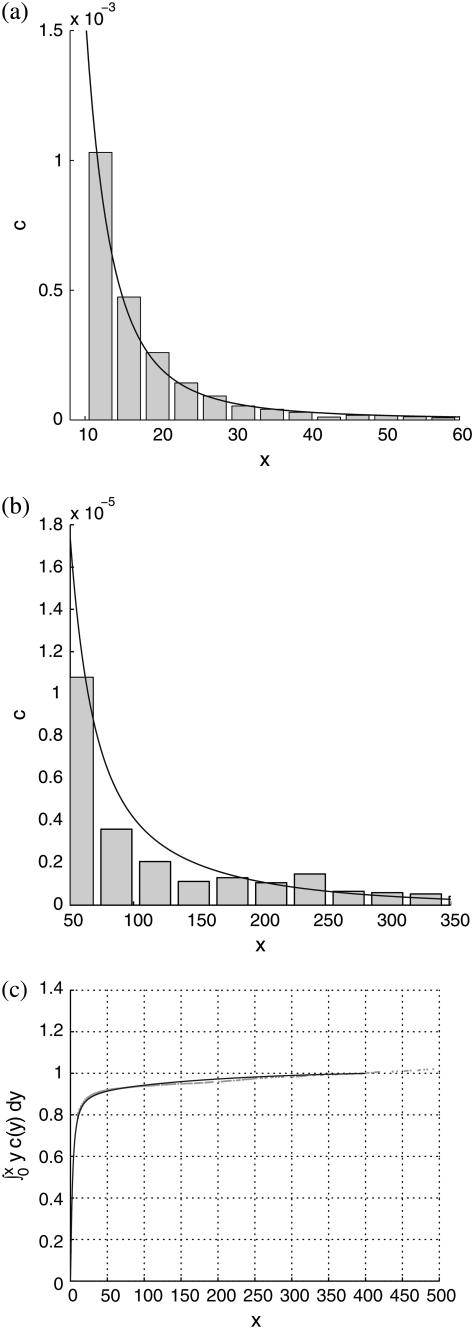
FIGURE 5.
Comparison of theoretical predictions with experimental measurements for the 33% cholesterol membranes. Experimental measurements were made over a total membrane area of 40 μm × 40 μm. Best-fit parameter values for the theoretical model are δ = 1/8000, ε = 0.2375. (a and b) Experimental data shown as histograms of number of rafts versus number of cholesterol molecules per raft (both scaled as discussed in text), against the theoretical curve. Different bin sizes are used in the two histograms. (a) The focus is on smaller rafts, where most of the cholesterol mass in the system resides. (b) The whole range of raft sizes is represented. (c) Cumulative cholesterol mass in the system as a function of raft size, with the solid line representing the theoretical prediction and the dots the experimental data points.

