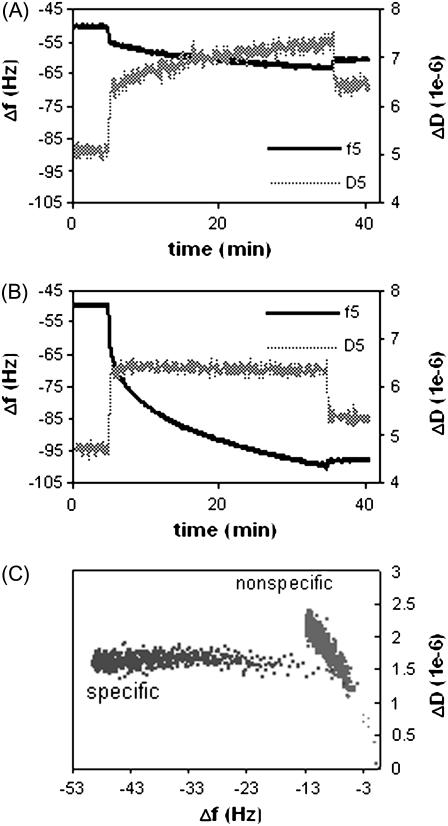
FIGURE 2.
QCM-D measurements of normalized Δf and ΔD signals versus time at overtone n = 5 for unliganded ERα (125 nM) to bind to a (A) non-ERE and (B) specific ERE immobilized on the surface, forming nonspecific and specific complexes, respectively. (C) ΔD-Δf plots for the formation of nonspecific and specific complex.

