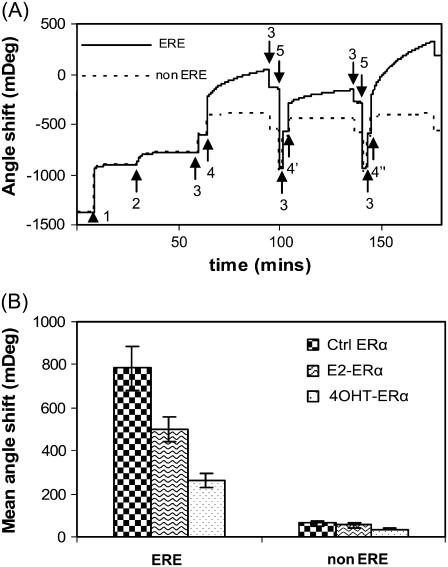
FIGURE 5.
(A) SPR sensorgram showing the binding reactions outlined in Fig. 1. Legend: Step 1: SA; 2: DNA immobilization (ERE, solid line, and scrambled non-ERE, dashed line, each in one channel); 3: HEPES buffer; 4: E2-ERα, 4′: 4OHT-ERα, 4″: Ctrl ERα; 5: 0.1% SDS. Immobilization of SA and DNA are carried out in PBS buffer. Identical SA (464 ± 5 mDeg) and DNA binding amounts (129 ± 6 mDeg) are achieved for the ERE and non-ERE channels. ERα (125 nM) was either preincubated with 10 μM 17β-estradiol (E2-ERα), 10 μM 4OHT-ERα, or ethanol (Ctrl ERα). Similar to the QCM-D experiment, addition of ERα samples to DNA layer introduced a buffer change effect (the ERα working solution contains some glycerol absent in the baseline HEPES buffer). Upon rinsing the surface at the end of the protein binding, this buffer effect is removed and the endpoint Δθ are recorded. (B) The SPR angle shifts caused by the binding of various ERα (liganded or unliganded) are averaged from three to five experiments.

