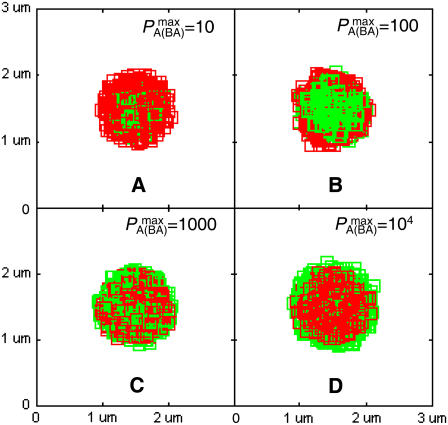
FIGURE 4.
Effect of varying BCR affinity ( ) on synapse formation. BCR/Ag complexes are shown in green, whereas LFA-1/ICAM-1 complexes are shown in red. The complexes are plotted in random order so as to simulate experimental intensity plots as closely as possible. In this set of figures the affinity of BCR was varied from
  to
to  (KA ≈ 105–108 M−1). In panel A the affinity is too low for synapse formation but in B we see that the difference in affinity between BCR and LFA-1 is sufficient to produce a synapse. This is no longer the case in panel C, where the affinities are equal, whereas an inverted pattern forms in D, where
  These images were taken after T = 105 time steps (100 s) with
  (KA ≈ 107 M−1), A0 = I0 = 2000 molecules, κBA = κLI = 40 μN/m, zeq(BA) = zeq(LI) = 42 nm, pdiff(F) = 1, pdiff(C) = 0.1,
 and
and 

