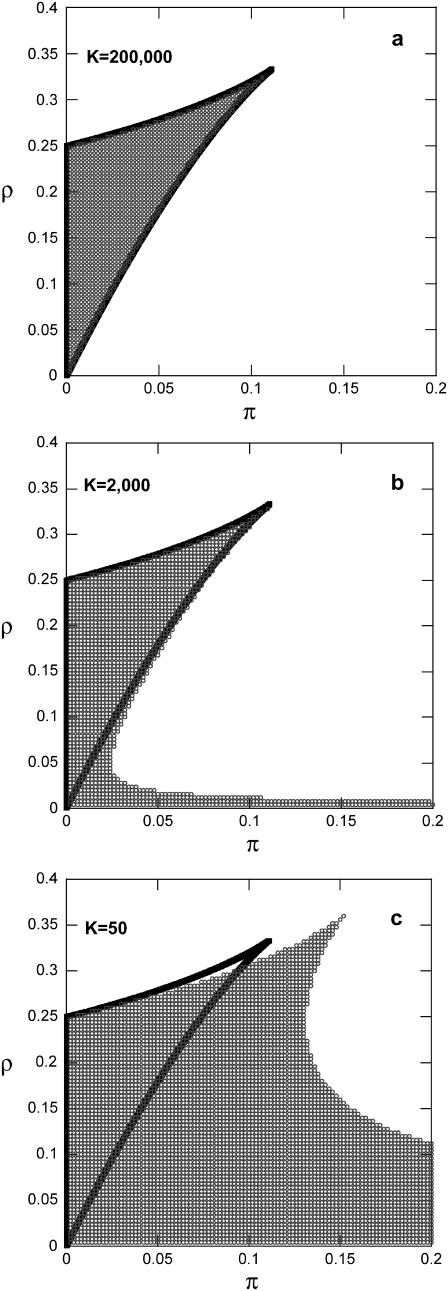
FIGURE 1.
Effect of rate of operator fluctuations (K) on the region of bistability at the single-cell level (δ = 1 and y* = 1000). (Solid lines) Single-cell deterministic model (steady state of Eq. 12). (Symbols) Single-cell stochastic model. (a) K = 200,000, (b) K = 2,000, and (c) K = 50.

