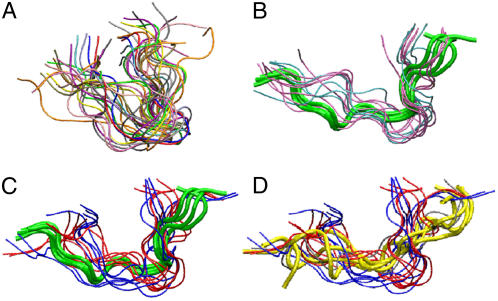
FIGURE 1.
Equilibrium conformations, generated by clustering the last 20-ns trajectories of indolicidin in (A) water; (B) zwitterionic lipid bilayers (DOPC, pink; DSPC, cyan); (C) anionic lipid bilayers (DOPG, red; DSPG, blue). Green tubes show NMR structure of indolicidin in DPC micelles (1g89.pdb). (D) The same set of equilibrium conformations of indolicidin in contact with anionic lipids as in panel C. Yellow tubes show conformation of indolicidin in SDS micelles (1g8c.pdb).

