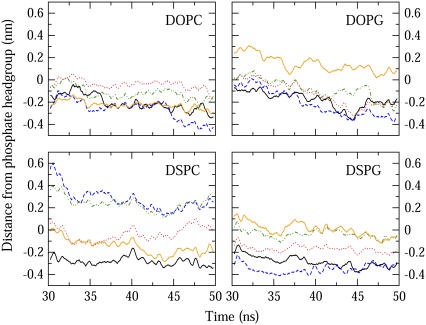
FIGURE 2.
Running averages of the distance between the center-of-mass of tryptophan residues and phosphorus atoms of top bilayer leaflet over the last 20 ns of the simulations; W4 (black solid), W6 (red dot), W8 (blue dash), W9 (green dot dash), W11 (orange solid). A more negative value corresponds to deeper penetration into the bilayer.

