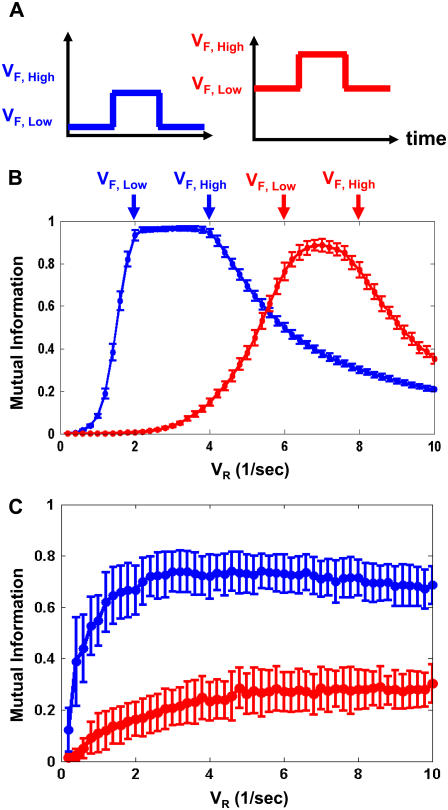
FIGURE 4.
Signaling quality dependence on kinase and phosphatase balance. (A) Two input stimuli with different background VF,Low and VF,High signal levels (molecules/s). Blue, VF,Low = 2; VF,High = 4. Red, VF,Low = 6; VF,High = 8 (shown by arrows on B). (B) Ultrasensitive cycle response to two stimuli as a function of VR (for KM = 5). (C) Hyperbolic cycle response as a function of VR (KM = 1000). Panels B and C plot mutual information between input and output. Pulse times are the same as in Fig. 3, and N = 100. Curves represent means, and error bars represent standard deviations, of mutual information over 100 trials.

