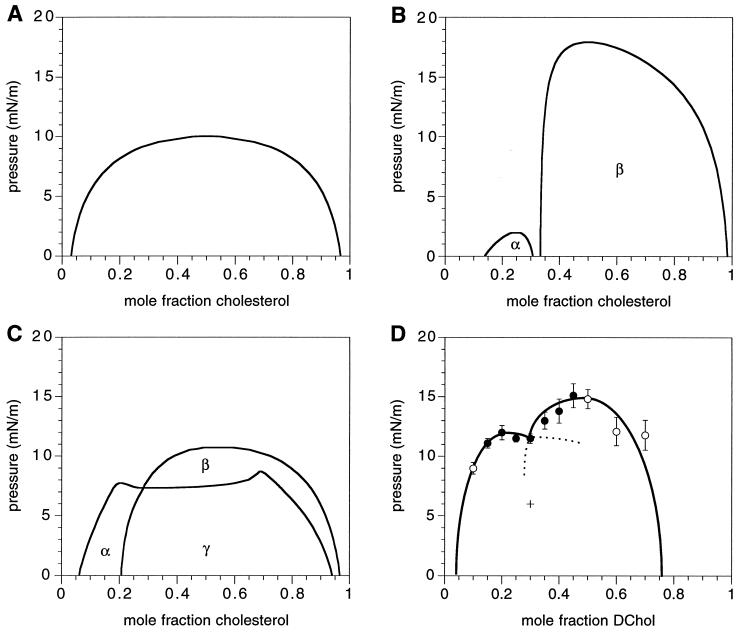
Figure 1.
(A–C) Calculated composition-pressure phase diagrams for mixtures containing cholesterol and one or more other lipids. (A) Binary mixture of cholesterol, C, with a non-complex-forming lipid U. (B) Binary mixture of C with a complex-forming lipid S. (C) Ternary mixture of C with U and S present in a 1:1 ratio. Regions of phase coexistence are identified as α, β, and γ. α and β are two-phase regions, and γ is a three-phase region. Compositions of coexisting phases were found by the method of double-tangent construction, using the free energy in Eq. 2 (28), with the parameters p = 2; q = 1; n = 1; Keq0 = 1,000; ΔA = −40 Å2; aSU = 0; a′CS = a′CU = a′CX = a′SX = a′UX = 1/6; πCS = 12 mN/m; πCU = 10 mN/m; πCX = 18 mN/m; πSX = 2 mN/m; πUX = 9 mN/m. “X” represents the complex CnqSnp. (D) Experimental phase diagram showing liquid–liquid miscibility critical points for a mixture of DChol and phospholipids. The phospholipid fraction is a 1:1 molar mixture of egg-SM and DMPC along with 10% GM1. Plotted data points indicate transition pressures where phase coexistence disappears during monolayer compression. Above these pressures, there is a single uniform phase. Stripe superstructure phases, which are characteristic of proximity to a critical point, were observed at the transitions marked by ●. The sketched dotted lines illustrate the possibility of a three-phase region as in C. The “+” symbol represents pressure-composition conditions used in Fig. 2. The error bars represent deviations in three independent phase boundary measurements.

