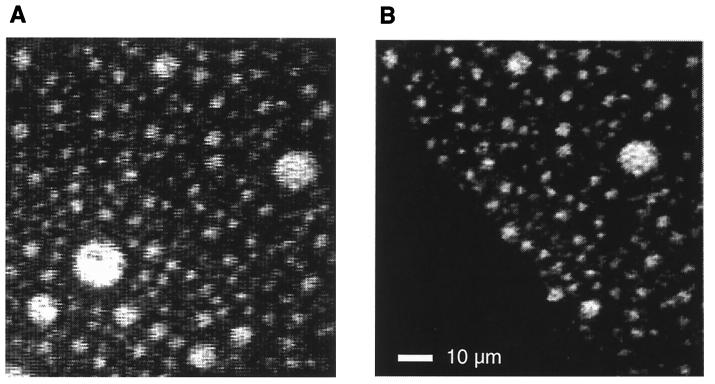
Figure 2.
Epifluorescence micrographs of a lipid monolayer containing 31% egg-SM, 31% DMPC, 7% GM1, 30% DChol, and 1% F-DHPE at a surface pressure of 6 mN/m. (The phase diagram of this mixture is shown in Fig. 1D, where the “+” symbol denotes the pressure-composition conditions used here.) The subphase contains Alexa-labeled CT-B. (A) View of the monolayer when observed with a F-DHPE-specific filter that excludes Alexa emission. (B) View of the same monolayer region when observed with an Alexa specific filter that excludes F-DHPE emission. When this monolayer is pressurized, all of the domains go through a critical phase transition at roughly the same pressure, suggestive of proximity to a tricritical point. The probe distribution demonstrates three coexisting phases.

