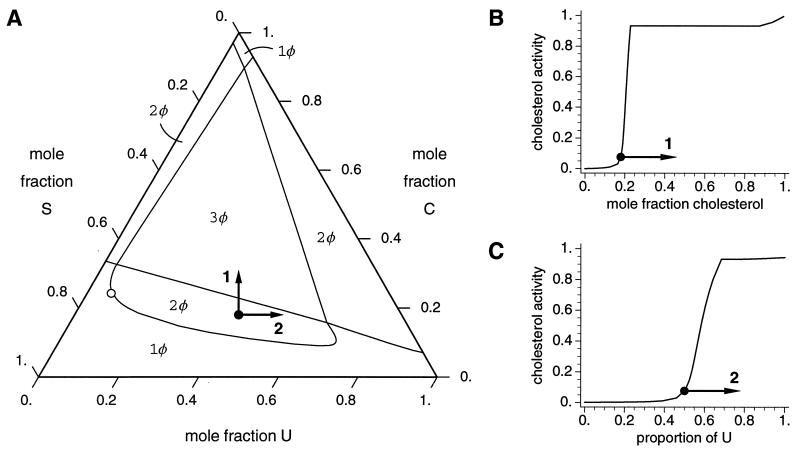
Figure 3.
(A) Calculated composition phase diagram for a ternary mixture of cholesterol C, with noncomplex-forming lipid U and complex-forming lipid S, using the same parameters as Fig. 1 A–C, for a surface pressure of π = 4 mN/m. Single-phase regions and regions of two- and three-phase coexistence are indicated by 1φ, 2φ, and 3φ, respectively. ○ indicates a critical point. The black dot denotes a mixture of 18% C and 41% each of S and U. Arrow 1 represents the addition of C to this mixture; arrow 2 represents an increase in the proportion of U in the nonsterol fraction. (B) Chemical activity of cholesterol as a function of cholesterol composition for a 1:1 mixture of S and U. (C) Chemical activity of cholesterol as a function of the proportion of U in the nonsterol fraction of a mixture containing 18% cholesterol. In B and C, the black dot indicates the composition of the mixture described in A; arrows 1 and 2 represent the composition changes described in A.

