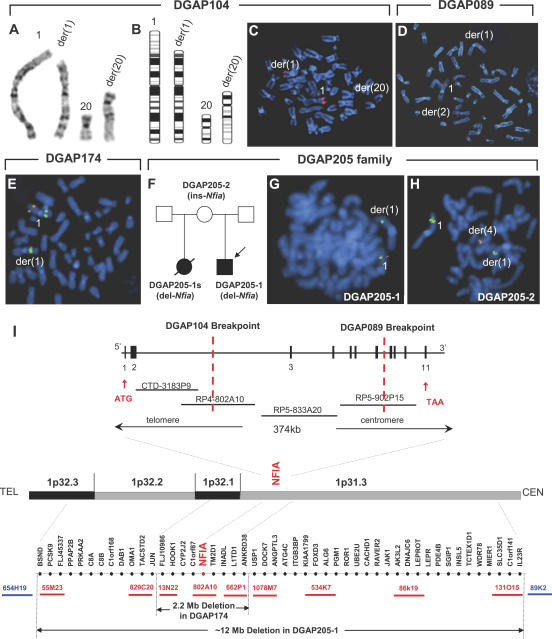
Figure 2. NFIA is Deleted or Disrupted in All Five Individuals with 1p31.3 Rearrangements.
(A and B) Partial karyogram (A) and ideogram (B) of DGAP104 show the chromosome translocation t(1;20)(p31.3;q13.31)dn.
(C) FISH analysis of DGAP104; BAC RP4-802A10 (red signals) hybridizes to the normal Chromosome 1 and der(1) and der(20) chromosomes, thus spanning the 1p31.3 breakpoint.
(D) FISH analysis of DGAP089 depicts BAC RP5-902P15 (red signals) hybridization to the normal Chromosome 1 and der(1) and der(2) chromosomes, thus spanning the 1p31.3 breakpoint.
(E) FISH analysis reveals that BAC RP5-902P15 (overlapping with NFIA, orange color) is deleted from the der(1) in DGAP174. The nondeleted BAC RP11-134C1 (green) is present on both the normal and derivative Chromosome 1.
(F) DGAP205 pedigree with NFIA deletion (arrow indicates the DGAP205–1 proband). DGAP205–1 and half-sister DGAP205-1s have an unbalanced interstitial microdeletion, del(1)(p31.3p32.3), while their phenotypically normal mother DGAP205–2 has a balanced chromosome rearrangement due to an insertion of 1p31.3-p32.3 into Chromosome 4, ins(4;1)(q35;p31.3p32.3). del-NFIA, deletion of NFIA; ins-NFIA, insertion of NFIA.
(G and H) FISH analyses show that BAC RP5-902P15 (overlapping with NFIA, orange color) is absent from the der(1) in DGAP205–1 (G) and der (1) in the mother DGAP205–2 (H), but present in the der(4) in the latter (H). The nondeleted BAC RP4-654H19 (green) is present on both the normal and derivative Chromosome 1.
(I) NFIA exon–intron structure is shown in the upper part with select exons numbered, and the relevant BAC contig below. Locations of the 1p31.3 translocation breakpoints in DGAP104 and DGAP089 are indicated by red dotted vertical lines. The lower part of (I) depicts 1p31.3–1p32.3 genomic regions with the cytogenetic bands on the short arm of Chromosome 1. TEL represents telomeric orientation, and CEN represents centromeric orientation. Known genes in this region are represented by dots and gene names. FISH-verified BAC clones are represented by horizontal bars. The full names of the BAC clones are listed in Materials and Methods. A 2.2-Mb genomic region deleted in DGAP174 and a ~12-Mb genomic region deleted in DGAP205–1 and 205–1s are shown. Deleted BAC clones tested by FISH are designated in red and nondeleted clones in blue. BAC 802A10 overlaps with NFIA and is deleted.

