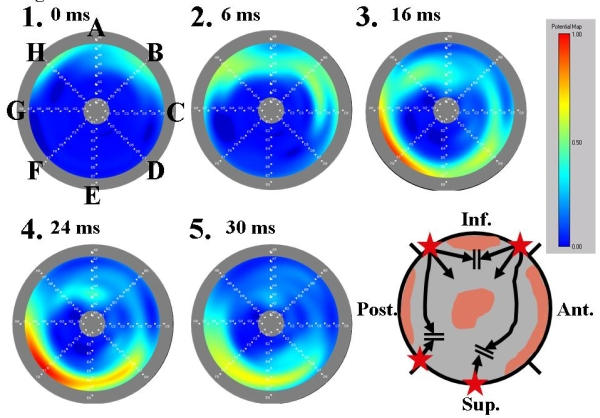
Figure 4.

A three-dimensional potential map of the left superior PV (LSPV) with three segmental electrical connections. The gray round outer frame corresponds to the PV ostium and center of the image to the distal PV (bull's eye image). The alphabetical letters from A to H in the figure indicate the MBC splines and the numbers the time order. The rectangular panel shows the color gradation setup. The schema shows the distribution of the PV musculature (gray area), which is identified by the three-dimensional potential map. The black arrow indicates the activation sequence within the PV. The star indicates an electrical connection identified by the three-dimensional potential map. The time intervals between map 1 and the 4 other maps are indicated on the right side of the map numbers. The activation entered into the LSPV through two segmental electrical connections at the inferior (spline B) and posterior wall (spline H) before the ablation. A part of the two activation wavefronts collided at the distal connection of the PV musculature around spline A. Another activation wavefront propagated toward the superior wall and collided with the late activation through the segmental electrical connection at the superior wall (splines E and F).
